-
- Developing and generating for our planet
- Doral’s Contribution to Reducing Emissions and Addressing for Climate Change
-
Innovation
Full chapter- Innovation
- A Leader in Israel’s Energy Storage Sector
- Doral Tech – Energy of Innovation
- A Bridge to Academia and Future Technologies
- Leading the Field of Dual-Use Renewable Energy Production in Israel
- Development of ‘Green Hydrogen’ Projects
- Development and Management of Environmental Infrastructure Integrated with Renewable Energy
- At the Forefront of Israel’s Green Electricity Market
- Reducing Water Consumption
- Preserving Biodiversity
- Waste Treatment and Promotion of Circular Economy
- Our Overall Environmental Impact – Greenhouse Gas Emissions Data
- Progress Against Targets
-
-
- Responsible and Ethical Management of Our Business
-
Corporate Management at Doral
Full chapter - Corporate Governance for ESG
- Business Ethics and Compliance at Doral
- Preventing Bribery, Corruption, and Conducting Internal Audits
- Information Security and Business Continuity
- Risk Management
- Responsibility in Our Value Chain
- Progress Against Our Targets
-

Our Overall Environmental Impact – Greenhouse Gas Emissions Data
-
160,276 tons
of CO2e emissions prevented in 2023, representing a prevention-to-emissions ratio of over 1000.
-
210 tons of CO2e
emissions generated directly and indirectly in Scopes 1 and 2 in 2023
-
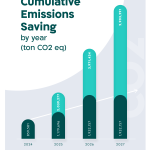
11,689,734 tons of CO2e
estimated emissions savings for the years 2024-2030
The Company’s approach is to minimize and mitigate the environmental impacts resulting from its activities while promoting and implementing advanced technologies that benefit the environment by reducing emissions and lowering the carbon footprint.
The operation of renewable energy facilities and company offices represents the majority of our Scope1 1 and 2 emissions. With the significant growth of the Company’s activities, there is a need to measure and update the baseline emission values caused by our activities and supply chain. However, it is important to emphasize that the Company’s assets continue to provide significant carbon emissions savings for our customers as consumers of renewable energy. In 2023, Doral prevented 160,276 tons of CO2 emissions, compared to the 210 tons of CO2 emissions generated by its activities directly and indirectly in Scopes 1 and 2, representing a prevention-to-emissions ratio of over one thousand.
Fuel Consumption in 2020-2023
| Fuel Consumption (in liters) | 2020 | 2021 | 2022 | *2023 |
|---|---|---|---|---|
| Gasoline consumption for transportation | 27,598 | 43,519 | 50,322 | 64,354 |
| Diesel fuel consumption for transportation | 0 | 1,983 | 2,818 | 713 |
| Total | 27,598 | 45,502 | 53,140 | 65,067 |
Project managers and other employees of the Company are provided with company vehicles as part of their role, which is used for day-to-day operations. Currently, most of the Company’s cars are hybrid vehicles. In the future, Doral plans to transition to electric vehicles to further reduce fuel consumption.
Electricity Consumption in the realization of Green Certificates in 2020-2023
| Energy Consumption and Emissions | 2020 | 2021 | 2022 | 2023 |
|---|---|---|---|---|
| Electricity consumption in kWh | 26,605 | 25,766 | 36,515 | 69,024 |
| Actualization of green certificates (total certificate value) in kWh | - | 26,000 | 38,000 | 72,000 |
| Total energy consumption (including the actualization of green certificates) in kWh | 26,605 | 234- | 1,485- | 2,976- |
| Carbon footprint - energy consumption - electricity (excluding the value of green certificates) in ton carbon dioxide equivalents (ton CO2e) | 13 | 13 | 17 | 31 |
| Carbon footprint - energy consumption - electricity (including the value of green certificates) in ton of carbon dioxide equivalents (ton CO2e) | 13 | 0.04- | 0.45- | -3.1 |
Doral’s Carbon Footprint for 2020-2023
| Total Carbon Footprint (in carbon dioxide equivalents – tons CO2e) | 2020 | 2021 | 2022 | 2023 |
|---|---|---|---|---|
| Scope 1 - direct energy consumption [1] | 62.8 | 105 | 125 | 179 |
| Scope 2 - Indirect energy consumption [2] | 13.2 | 13 | 17 | 31 |
| Total emissions from Scopes 1+2 | 76 | 117 | 143 | 210 |
| Scope 3- Indirect emissions [3] | - | 39 | 192,030 | 232,154 |
| Indirect emissions of greenhouse gases (Scope 2) - including the actualization of green certificates, in carbon dioxide equivalents (tons CO2e) | 13 | 0.04- | 0.45- | -3.1 |
Carbon Footprint Trend Graph for Scopes 1 & 2, 2020-2023

Carbon Footprint Trend Graph for Scopes 1 & 2, 2020-2023 – Including Actualization of Green Certificates
Emissions Intensity in 2020-2023
| Emissions Intensity Scopes 1 and 2 (in carbon dioxide equivalents tons CO2e) | 2020 | 2021 | 2022 | 2023 |
|---|---|---|---|---|
| Revenues (million tons of carbon dioxide equivalents/million $) | 6.26 | 6.44 | 4.9 | 6.19 |
| Employees (million tons of carbon dioxide equivalents/ full-time employees) | 1.43 | 1.71 | 1.27 | 1.32 |
Emissions from fuel energy consumption for travel.
Energy consumption from the electric company serving the Company’s facilities for the operation of solar installations and company offices (including in the U.S. in 2022).
*Emissions resulting from indirect activities, including emissions from the production of panels (based on Ecoinvent database), emissions from significant suppliers (as declared in a supplier assessment conducted in 2022), flights, water consumption, wastewater treatment, and landfill of panel waste. These emissions fall under categories 1, 5, and 6 according to the GHG Protocol.